

An Introduction From Alex Arlint
The National Air and Space Intelligence Center’s (NASIC) mission is to discover and characterize threats in the air, space, missile, and cyber domains to enable full-spectrum multi-domain operations, drive weapons systems acquisition and lifecycle support, and inform national defense policy. To achieve this mission, NASIC conducts Scientific and Technical Intelligence (S&TI) for a wide-variety of sensor phenomenology, data sources and formats, and uses hundreds of software tools to do so. Over the past decade, sensor modernization efforts and improved transport mechanisms have dramatically increased the quality, and quantity, of data available for S&TI analysis. As a result, the legacy processing, exploitation, and dissemination (PED) architectures hosting the aforementioned tools have struggled to keep pace, often resulting in less than 50% of data being analyzed. Additionally, data conditioning and analytic processes are manual and time-intensive, pushing the limits of the personnel-constrained organization. The inability to effectively leverage improved data from modernized sensors and transport mechanisms clearly demonstrates that NASIC’s S&TI architecture is no longer sufficient to keep pace with the Center’s mission.
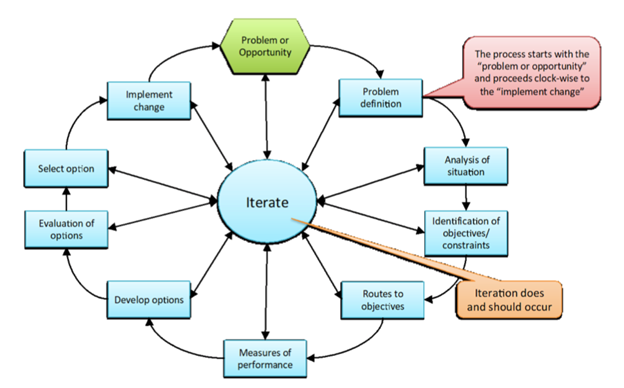
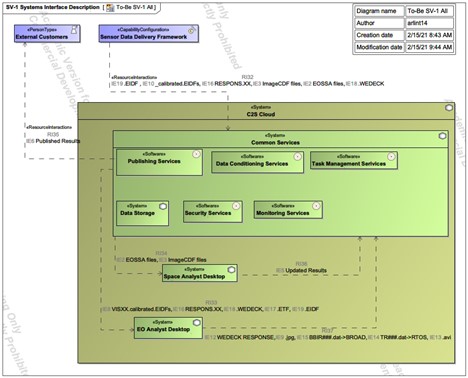
This paper by Alex Arlint will present an executable approach for modernizing NASIC’s S&TI architecture starting with the Measurement and Signature Intelligence (MASINT) mission. The narrowed problem will be defined in terms of the bounded system and relevant stakeholders, the situation will be analyzed, objectives and constraints will be identified, routes to objectives and measures of performance (MOPs) will be discussed, design options will be developed and evaluated, and the option that provides the best balance of cost and performance will be selected. The Hard Systems Methodology (HSM) will be used to guide this research since the problem can and has been stated by each mission lead in an objective way and is iteratively refined with those stakeholders (Board, 2014). The HSM shown in Figure 1 provides a logical framework to guide this capstone research as there exists an unfavorable present state of the system, a desired state, and alternative ways of getting from present state to desired state. The difference between states essentially describes the needs from the stakeholders and the explicit recommendation for iteration between steps facilitates refinement to ensure the needs are accurately understood, especially as new information arises.
Hard Systems Methodology: Narrowed Problem Definition
Across the Center, Alex Arlint notes that the nature of the problem can be characterized in four major categories: (1) infrastructure/architecture, (2) data, (3) analysis tools/processes, and (4) workforce culture. In this paper, problem areas 1-3 are analyzed together using two specific MASINT mission area examples and problem area 4 is analyzed in context of problem areas 1-3.
Within NASIC, the issue of inadequate infrastructure and architecture to enable rapid and thorough processing of sensor data for delivery of intelligence products that provide value to the Center’s mission is well known. An opportunity to examine during the course of this research is leveraging the work of the NASIC Enterprise Architecture Office (EAO). The NASIC EAO is currently designing and developing an enterprise-level, modern, hybrid-cloud, service-oriented architecture (SOA) to provide dramatically improved data ingest, common services, scalability, and intelligent automation for multi-INT data correlation and fusion. This is specified as an opportunity in that the EAO is only designing and developing the foundational architecture, but are not necessarily responsible for generation of mission-specific requirements or mission integration. In this regard, the MASINT missions could potentially leverage the enterprise architecture to remedy the aforementioned problems. However, before mission-specific requirements can be generated, and integration considerations fleshed-out, the MASINT “As Is” architecture must first be defined in terms of structure, behavior, requirements, and any constraining policy or guidance.
Due to time and resource limitations, this capstone research will be strictly bounded to the MASINT missions, and will not address other intelligence areas such as Signals Intelligence (SIGINT), Human Intelligence (HUMINT), or Geospatial Intelligence (GEOINT), which also contribute to NASIC’s enterprise capabilities. As previously described though, the nature of the problem is consistent across those other intelligence mission areas and the approach undertaken to solve this in the MASINT context can also be applied to the other areas.
Hard Systems Methodology – Analysis of the Situation- High Level:
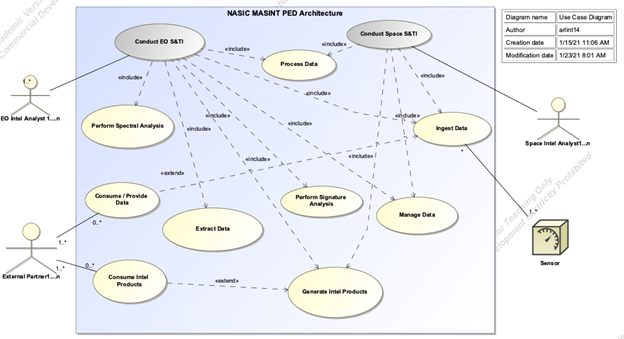
Alex Arlint notes the goal of this capstone will be to examine and address the four aforementioned problem areas of (1) infrastructure/architecture, (2) data, (3) analysis tools/processes, and (4) workforce culture for each of the MASINT mission areas from a systems engineering perspective implementing systems engineering best-practices to remedy the problem. The MASINT mission areas to be assessed include Electro-Optical (EO) and Space. Additionally, MASINT includes external partners who leverage a combination of the NASIC architecture and their own for the execution of their missions. With time, resources, and classification as limiting factors, the system under assessment will be bounded to include only the local NASIC MASINT architecture, infrastructure, tools, data, and processes, and those partners will be reflected as abstracted external systems that interact with the NASIC system to consume intelligence products and/or data. The use case diagram in Figure 2 illustrates the bounding of the system and external partners. Figure 2 shows only the EO S&TI and Space S&TI use cases for the MASINT architecture, but could also include the other mission use cases for the architecture. As such, the included use cases inside the EO and Space use case are depicted as <> to represent the fact that they are common use cases, which could be shared among other MASINT mission areas as well. The external partner use-cases of consuming/providing data and consuming intel products are depicted as <> as they may only be executed sometimes when the ingest data and generate intel products use cases are executed, but not necessarily every time. They are depicted as a 0-to-many multiplicity.
Hard Systems Methodology: Analysis of the Situation – Space MASINT
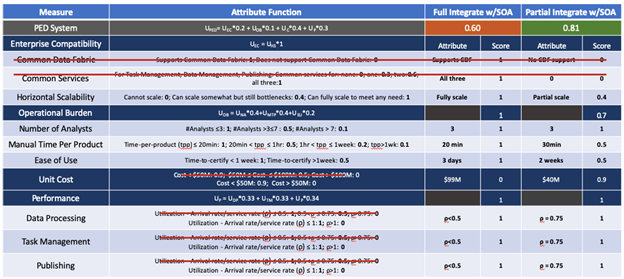
As mentioned above, the MASINT “As Is” state should be defined, performance levels identified, and problem specifics detailed before the possibility of leveraging the EAO Architecture can be pursued. To illustrate the “As Is” architecture, a DoDAF Systems Viewpoint (SV-1) is used to show the static composition and interactions of the Darkstar system, which is the Space MASINT event-driven PED architecture (Figure 3). Note that the external systems and organizations are shown in blue; a convention that will be maintained through this capstone. The key sub-assemblies, resource flows, and physical assets are included to provide high-level conveyance of the system concepts and resource flow requirements.
The Darkstar processing framework watches for new files being ingested and then leverages the message broker to orchestrate analysis tool execution using one-to-many windows-based worker nodes. The analysis tools conduct change-detection and analysis on space-based assets to inform the broader space community. Once the tool(s) have completed their job, updated results are sent to the Darkstar database and made available to external customers via a portal and website. As this design was slowly added onto and adapted over the years, the framework has realized a few significant drawbacks. The primary issue is deconflicting and managing tool and platform dependencies in the worker nodes since the python-based tools are tightly coupled with the Darkstar API code. This also means that each worker has an instance of the Darkstar code.
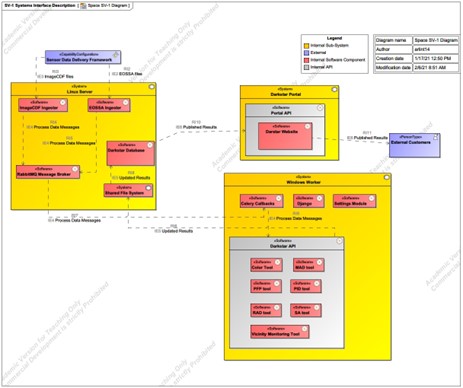
Since the processing is done on a single physical server, crashes or maintenance down-time take the whole system out of operations and results in a backlog of data that needs to be processed, as the system cannot dynamically scale resources to catch up (Godar, 2020). This viewpoint also illustrates the earlier description of the problem in that each PED system has its own stove-piped data storage, processing and dissemination, making multi-INT object-based production nearly impossible.
Hard Systems Methodology: Analysis of the Situation – EO MASINT
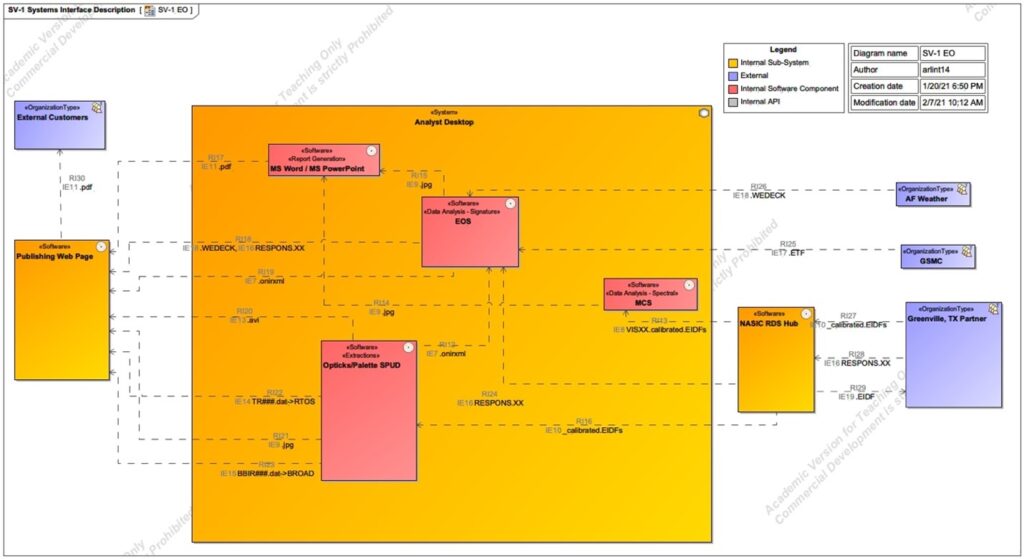
As seen in the SV-1 below (Figure 4), the EO MASINT mission ingests data from external customers who provide pre-processed EO data from their collection platform. They also rely on Event Trajectory Files (ETFs) from the Trajectory Reconstruction MASINT mission and weather files from the Air Force Weather System. Analysts are manually assigned tasks to perform extractions on the EO data. The task management is largely handled off-line with Microsoft Excel-based spreadsheets and emails, which is inherently inefficient. The extracted data, which is a custom .xml format, is used to feed the spectral and signature analysis steps. Once analysis on the event is completed, reports are manually generated using Microsoft Office products and then made available on a customer-facing classified portal and also manually disseminated to appropriate networks, typically from top secret down to secret. The key theme in the aforementioned process is the manually-intensive nature of the workflow. Each of the ~3 EO analysts spends 3-4 hours per week manually finding data, managing tasks, generating reports, and disseminating products which could be done automatically in a matter of minutes with minimal man-in-the-loop time spent quality checking those automatically generated outputs (Bottomley, 2021).
Hard Systems Methodology: Analysis of the Situation – Workforce Culture
Now that the high-level “As Is” composition and interactions for the EO and Space S&TI mission have been introduced, they can be tied back to the four problematic categories that drive the overarching problem of reduced ability to address growing data feeds and provide content-dominant intelligence products in a timely manner. As shown above, the architecture and infrastructure for EO and Space are stove-piped; their data feeds and storage are separate resulting in an inability to perform easy cross-mission data sharing. As illustrated in Figure 2, they share a similar capability need in terms of task management, data ingest, data processing, and report generation and dissemination, but have been instantiated in their own stove-piped, manually intensive way. The processing tools (e.g. Palette, EOS, MCS, PA Tool, MAD Tool, etc..) are written in legacy languages, inefficient in execution, manually intensive, unable to adapt and scale, and incorporate poorly-documented, highly-deficient algorithms that degrade the quality, quantity, and timeliness of the products being generated.
The reasons behind the current state of the MASINT S&TI architecture leads to the fourth problem category; workforce culture. These mission-specific tools and processes were developed largely in-house over several decades by analysts who are still there advocating for them. Additionally, through various interviews with each of the mission teams it has become evident that the teams receive very tool-specific and process-specific training in order to gain their analysis certification, and are trepidatious about changing the way in which they conduct their analysis. Before the EAO Enterprise Architecture can be assessed as a feasible solution to remove the mission technical stove-pipes, the workforce culture stove-pipes must be dismantled. The teams will have to think about data in a modern, enterprise fashion. They will have to be shown how moving client-side processing and manually-intensive data cleaning, tagging and structuring to the cloud will not constrain them or make them less relevant, but rather enable them to produce better intelligence faster. Booz Allen Hamilton summarized this concept well in their assertion that PED modernization must operationalize the tenet that machines should do analytics and people should do the analysis (Kimmons & Gilmer, 2019). All of this can and should be catalyzed through the role of the program manager, systems engineer and system architect. The EAO Enterprise Architecture is established on the tenets of speed and agility. A team that has been ingrained in doing things the same way for decades cannot innovate in the same fashion (Modigliani, 2016). The program manager, systems engineer, and system architect must work with the mission teams to break down existing processes and tools into constituent capabilities and functions. Only then can the system’s users be shown, in a quantified instantiated manner, how those capabilities can be optimally transitioned to a modern architecture to deliver value to the users, and to the NASIC mission.
Hard Systems Methodology: Identification of Objectives and Constraints
Alex Arlint explains the Center seeks to migrate legacy data flows to an enterprise data catalog with common metadata tagging to facilitate Artificial Intelligence and Machine Learning (AI/ML) for faster multi-INT data correlation and fusion, shift the stove-piped storage and infrastructure to a common IT infrastructure, move legacy client-side processing to the cloud and automate as much of the processes as can be reasonably done to free up the analysts to focus on their content-dominant analysis. The Center’s objective can and does trickle down to the MASINT squadron. However, there are several constraints that will have to be overcome to include organizational relationships, policy and guidance, and funding.
NASIC has a complex relationship with other organizations and data providers. Some of the data NASIC receives is constrained by policy and guidance pertaining to which networks it must “live” on and who can access it. Programmatically, funding is also a constraint. There is a healthy out-year budget to address these objectives; however, the funding was identified and agreed upon before formal capabilities and requirements were structured. In this regard, NASIC is putting the cart in front of the horse and will surely find that the allocated funding will not be enough to do everything. Subsequently, trade-analysis and prioritization will be another constraining factor.
Hard Systems Methodology – Embracing iteration to reassess the situation
Now that the problem and situation have been defined and examined around some top-level objectives, the next steps of the HSM can be executed to include: exploring the routes to the objectives, defining measures of effectiveness, developing and evaluating options, and then selecting the option to be implemented. Before exploring the routes to the desired objectives; however, it is necessary to iterate back through the analysis of the situation to further define the “As Is” form and function in greater detail. To do so, a DoDAF OV-2 is used to compliment the SV-1 in defining the form, and an OV-5a and OV-5b will be used to describe the function which that form implements. Iteration and analysis of the situation will help refine the problem definition and ensure sufficient capture of the undesirable aspects of the baseline configuration before examining stakeholder requirements and potential routes to solutions.
Iterating Analysis of the Situation: System Form (Structure)
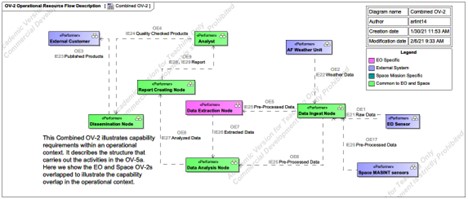
Now that the composition and interactions of the “As Is” EO and Space systems has been addressed through use of an SV-1, further definition of the current structure (form) of the systems is accomplished through use of an OV-2. The OV-2 provides the logical architecture that is realized and instantiated in the SV-1. It also helps define the capability requirements within a solution-neutral operational context and highlights the capability boundary (DoD, 2009). The OV-2 model of capabilities will be a crucial catalyst for defining and refining stakeholder requirements and then examining potential design solutions against a set of solution-neutral capabilities and requirement so as to avoid bias based on “As Is” instantiated structure, which harkens back to the legacy-ingrained mindset of workforce culture that was discussed. In fact, when interviewing the EO and Space teams, it was explicitly observed and stated that this solution-neutral logical model of the systems helped the non-technical stakeholders better understand how potential “To Be” SOA-instantiated solutions can meet the existing, and desired, capability needs of the users.
As seen in Figure 5, the OV-2 has been structured to combine the EO and Space missions, contrary to the previous structuring of the SV-1s which were kept separate between the two missions. The reason for modeling in this manner ties back to the use case diagram that was constructed for the MASINT PED architecture in Figure 2. The use case diagram, which shows the functionality of the system from the user perspective, shows that EO and Space both use the architecture to ingest, process, and disseminate data. The two SV-1s show that the instantiation of these functions is different and disparate. The combined OV-2 modeling technique was an intentional approach to illustrate not only the overlap of the aforementioned top-level functionality use-cases, but also the commonality of operational performers and resource flows. Both systems make use of ingest nodes to serve-up pre-processed sensor data to extraction and/or analysis software. Both make use of analyzed, quality-checked (QC) data to generate reports, QC reports, and disseminate those reports to 1-to-many networks and customers. With the exception of extractions, the solution-neutral logical structure of the two systems are almost identical. In the following sections of this paper, an OV-5a will be used to describe the function that this form satisfies, and the operational hierarchy will be used to show that the functions which underlie this form are also largely the same with a few distinct differences that will have to be considered in subsequent design.
Iterating Analysis of the Situation: System Function (Behavior)
While form is an important system attribute and the instrument of function, it is the internal functions through which system emergence is realized and value is provided (Crawley, 2016). In this case, that externally delivered value is the finished intelligence products to inform timely, data-driven decisions. Before describing the functions that the aforementioned form executes, it is important to understand the Principle of Benefit Delivery stated by Crawley: “Good architecture delivers benefit, first and foremost, built by the primary externally delivered function of the systems by focusing on the emergence of functions, and their delivery across the system boundary at an interface” (Crawley, 2016). Recalling that function equals process plus operand, it can be stated that the value-related operand of the PED architecture(s) is the sensor data and the value-related process is the S&TI conducted on that data. This is the function for which the system was built and is the function that is delivered externally from the system. This is the function that comes to mind when applying the Principle of Benefit Delivery to the context of this system.
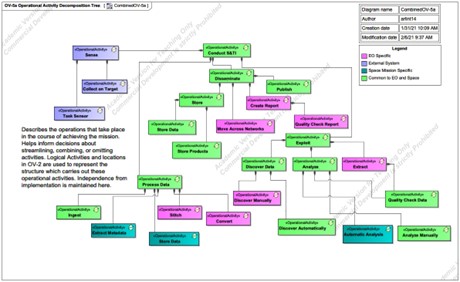
In this regard, Alex Arlint notes the OV-5a Operational Activity Model (Figure 6) starts with that primary externally delivered function and decomposes the hierarchy from there. The reason for choosing an OV-5a to describe the function of the system is that it helps illustrate the functional overlap of the “As Is” EO and Space to compliment the logical structure overlap identified in the OV-2 which collectively contradict the physical structure separation identified in the SV-1. Essentially, it illustrates that the “As Is” form is an inefficient instrument of the value-delivering functions. One of the key intents of the OV-5a is to help make decisions about streamlining, combining, or omitting activities (DoD, 2009) which is precisely the benefit realized from this. Upon visual inspection, it can be observed that there is a potential to streamline structural implementation of the second-level functions; process, exploit, disseminate (PED) and certain third-level functions under those which are common to both missions (shown in green). Recalling from Crawley that value equals benefit at cost, it seems logical to assert that two distinct systems working separately to provide similar functions does not provide as much value as one system working holistically.
While the SV-1, OV-2, and OV-5a provide good insight into form and function inefficiencies which contribute to, and are indicative of, the problem definition, the operational activity flows (object and control) should also be defined to examine any resource exchanges or relationships between operational functions shown on the OV-5a in order to identify commonalities. As Maier and Rechtin stated; “Architects increasingly need behavioral models as systems become more intelligent and their behavior becomes less obvious from the systems form … unlike a building, a client cannot look at a scale model of a software system and infer how the system behaves” (Maier & Rechtin, 2009). This is especially true for this system assessment. While the system form identified in the SV-1 and OV-2 can be examined and some commonalities of form can be identified, the true internal behavior could be drastically different between the two. The OV-5a provides insight into hierarchical function and commonalities therein, but the OV-5b will be a more detailed mechanism for identifying and assessing commonalities and differences pertaining to how lower-level functions interact with one another and what resources are exchanged.
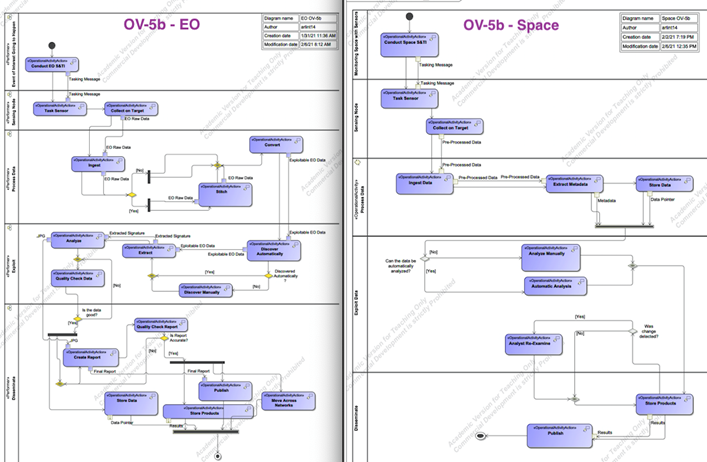
Through analysis of the OV-5b it is discovered that the control flows between functions are largely similar but the resources or objects that flow between each are quite different between the two missions. For instance, for both EO and Space, ingest is followed by data discovery, then analysis, then quality checking results, and finally publishing of the results or reports. However, the type of data and products between each is different. This will be a key system aspect to consider when examining potential streamlining solutions.
In addition to bolstering understanding of functional flows and commonalities therein, the system behavioral insight garnered in the OV-5b can help point towards how to best assess the performance aspects of the system. For instance, when examining the OV-5b, an interesting observation about the behavior of the system can be made. As data of various types and formats is ingested to the system boundary from the external sensing frameworks, it goes through 1-to-n steps for initial processing before it can go through 1-to-n exploitation functions which is also a prerequisite for all the steps associated with dissemination. In this regard, there are themes of arrival, waiting, and service mechanisms: a queuing system (Blanchard & Fabrycky, 2006). This actually makes a lot of sense when considered in the context of the earlier point regarding NASIC’s problem keeping pace with the dramatic increase in data arising from improved sensors and transport mechanisms. It is a clear problem of the linear stove-piped queuing system’s inability to dynamically scale and serve all of the arriving customers (data feeds) coupled with inefficient service mechanisms (manually intensive linear tools and processes).
Nonetheless, this provides a good place to start quantifying the “As Is” performance of the system using an approach that can also be applied to the “To Be” options. To do so, the R programming language was used to construct a model of this baseline queuing system. As the actual data inter-arrival times and file sizes border on some classification concerns, a ‘dummy’ set of data was used which reflects the nature of the real data and could be easily exchanged for a .txt or .csv of the actual data ingest inter-arrival times and sizes if executed on the appropriate network (Stackexchange, 2015). The PED system can be modeled as a multi-channel multi-phase queuing system as illustrated below in Figure 8:
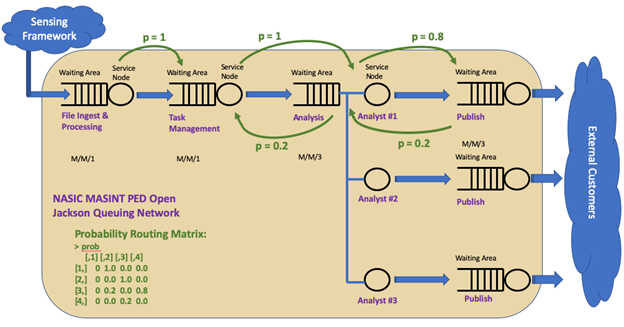
A queuing network can be used when several stages or places need to be visited in order to obtain full service, as is the case with the PED queuing network (Montoya & Jimenez, 2017). In this regard, the queuing network illustrated in Figure 8 can be modeled as an open Jackson network (OJN), with assumed Poisson arrival process of the data since the data arrivals are all random and independent of each other. The PED OJN has 4 nodes: file ingest and processing, task management, analysis, and publishing. The probability of moving from file ingest to task management is 1 as is the probability of moving from task management to analysis. Once in analysis, there is a 0.2 probability that the data goes back to task management to get reassigned elsewhere or for other various reasons. There is a 0.8 probability that it moves forward to report publishing. Once in the report publishing phase, there is a 0.2 probability that it is returned to the analysts for re-work. This structure is reflected in the probability routing matrix used to construct the OJN and conveyed in Figure 8. These probabilities are rough estimates based on personal experience in this workflow. The real probability routing matrix could be structured by querying the task management tools on the classified networks and examining the state changes of those tasks between these nodes to structure probabilities of state changes to certain nodes, but is omitted from this capstone due to classification concerns.
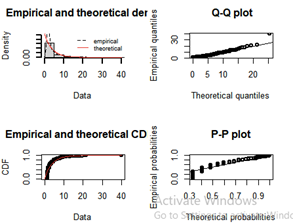
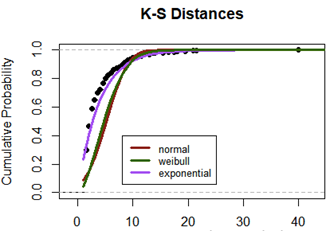
As mentioned earlier, a ‘dummy’ dataset with n = 397 data points was used to model the arrival rate of the calling population (data acquisition from the sensing framework). Once pulled into the model in R, distribution fitting was performed with associated goodness-of-fit testing to ensure that the interarrival times of the data do in fact follow a Poisson process (e.g. exponentially distributed interarrival times). The average arrival rate was determined to be λ = 1file/3.833sec = 0.2608 files/sec. The average service rate for node 1 is μ = 0.0033 files/sec, node 2 is μ = 0.0033 files/sec, node 3 is μ = 0.00055 files/sec, and node 4 is μ = 0.00055 files/sec. An immediate observation is that the arrival rate at node 1 is greater than the service rate, which is used to further illustrate the previously conveyed inability of the system to handle the influx of data. This OJN was modeled in R using the NewInput.MM1/C functions to define each node and then combined with the probability routing matrix using the QueueingModel function to execute the OJN. In execution, it was observed that system utilization is at ~7,820% and system throughput is only .0033 files/sec. While this is an exaggeration compared to what the real interarrival time data and throughput would provide, it definitely reflects the problem definition in instantiated performance-driven terms. The key system measure of performance (MOP) can now be identified as the net service-rate of the queuing system. If the arrival rate of the data from the sensing framework is greater than the net service-rate of the queuing system, then the system utilization, ρ (arrival rate divided by service rate), will be greater than 1, indicating that data is arriving faster than it can be served and the waiting line of data will grow without bound.
With the problem defined and framed around the decomposed “As Is” form, function and performance, the next steps are to define stakeholder requirements, develop design options, evaluate those options, and select the optimal path forward.
Mission and Stakeholder Requirements, According to Alex Arlint
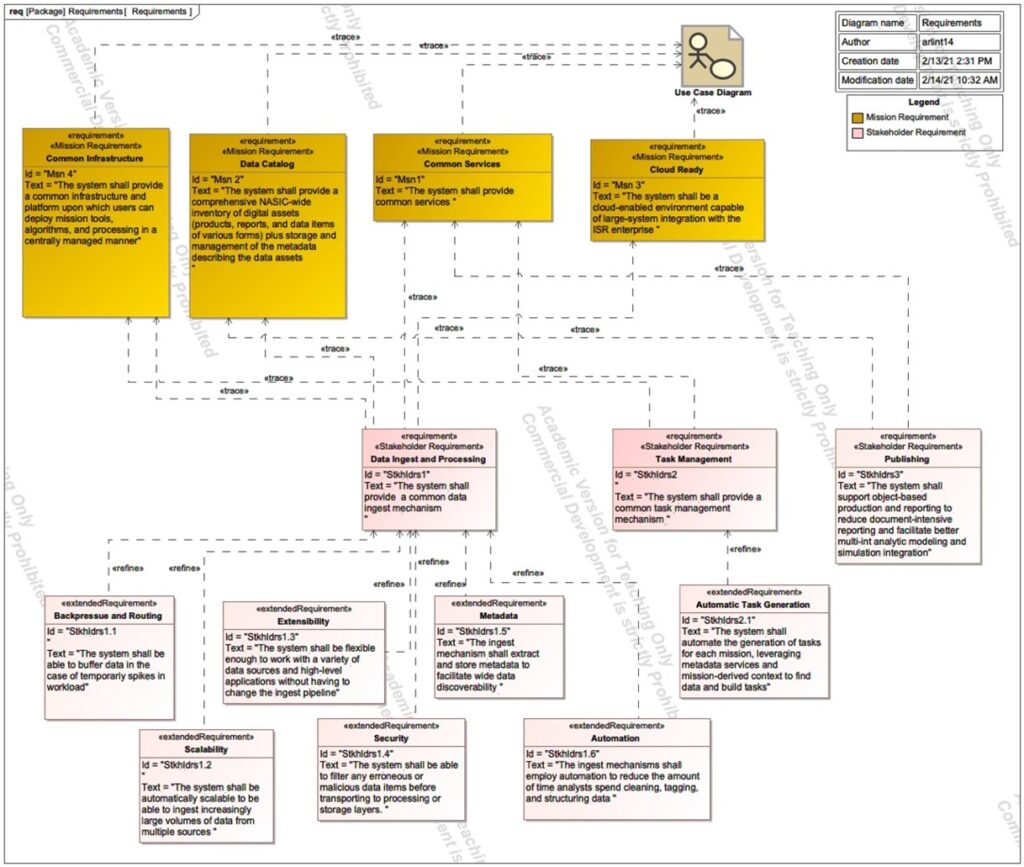
In order to effectively design and assess potential solutions, there must be clear standards and measurement tools against which the success of the future system can be judged. This is the invaluable utility of requirements. Requirements can be viewed hierarchically with mission requirements at the top, followed by stakeholder requirements which are contextualized around the mission requirements, and then system requirements to translate the stakeholder requirements into engineering terminology (Buede & Milller , 2016). This capstone will focus primarily on the key mission and stakeholder requirements and will not delve into the system or component requirements. Figure 10 shows the four top-level mission requirements and the stakeholder requirements which trace to them. Once again embracing the advice of Buede, the requirements are structured to be as design independent as possible to avoid constraining potential design and decision space. That said, the mission requirements do constrain solutions somewhat in the fact that the super-system, for which these PED systems are part of, must be cloud enabled and prescribes the necessity of common services. However, the prescription of common services and a cloud environment does not actually constrain the solution space, but rather facilitates the streamlining of services and processes discussed in the context of the SV-1s, OV-2s, and OV-5a/b. Additionally, the mission and stakeholder requirements below show that the use-cases for the system have not necessarily changed, rather the form and function to fulfill those use cases needs improved in order to garner favorable MOPs.
Hard Systems Methodology: Develop Options
Through examination of the behavioral, structural, and requirements diagrams described thus far, a couple design alternatives immediately begin to emerge:
Option 1: Fully SOA Integration
There is a potential opportunity to fully leverage the SOA being developed by the enterprise architecture office. With a bolstered understanding of the system’s current form and function, potential design solutions can be better assessed. In order to fully streamline the data-ingest, task management, and publishing bottlenecks of the “As Is” architecture, each capability could be re-designed and re-developed as common services and algorithms riding on the components layer of the hybrid-cloud enterprise SOA integrated with the enterprise data catalog. Baseline computation requirements can be identified and leveraged as derived requirements on the SOA development team to ensure appropriate baseline resourcing and scalability can be planned for to mitigate any chances of backpressure of data ingest or processing. This option has the potential to deliver the optimal queuing system solution for PED. This is likely to be the most expensive and development time consuming option but has the highest potential to satisfy mission and stakeholder requirements and build a foundational PED architecture which remedies all problems identified in the earlier problem definition. This option does present significant challenges when framed around the aforementioned workforce culture aspects of the problem definition, as full stakeholder buy-in to this route would inevitably be difficult to garner given the legacy-ingrained mentality.
Option 2: Partial SOA Integration
Another option would be to upgrade existing databases and services to “hook into” the enterprise catalog to improve data discoverability and deliver limited automation. The pitfall of this approach is the retention of stove-piped infrastructure and processes. This option also presents risk to meeting mission and stakeholder needs. That said, this option would be substantially cheaper and more palatable to the legacy-ingrained workforce.
Hard Systems Methodology: Evaluate Options
There appears to be many different criteria that will contribute to the evaluation of these two alternatives such as cost, ability to satisfy requirements, technical performance expectations, and user satisfaction. In this regard, Multi-attribute Utility Analysis (MUA) can be used as a technique to evaluate these alternatives (NSA, 2000). In doing so, the components or attributes of value will be defined, value functions constructed, alternatives scored, and sensitivity analysis conducted on the assumptions and judgements.
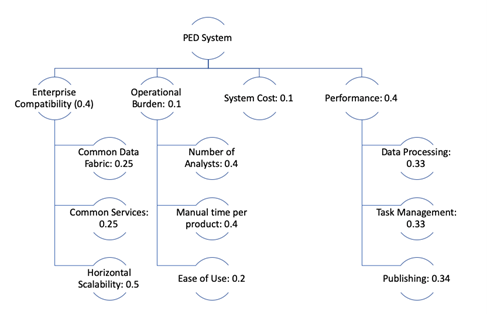
Figure 11 gives the breakdown of value attributes and their assigned weights. The value attributes and weights were generated by the modernization program manager in collaboration with the stakeholders and are reflective of objectives and requirements. Enterprise compatibility was given a higher weighting than other system-level attributes due to its criticality and specificity as a mission requirement. Horizontal scalability, at the low-level within enterprise compatibility, was given the highest leaf-level weighting as it is one of the biggest aspects of the current problem definition as illustrated in the DoDAF views. Performance was also given a high weighting as it pertains directly to the problem definition. Cost was given a relatively low weighting, as it is an overlapping attribute and the costs of each alternative are within budget. If the system costs between alternatives were more substantial or the overall costs were high enough to impact certain decision aspects (i.e., potential applicable oversight and reporting restrictions for ACAT I/II/III program) it would be given a higher weighting.
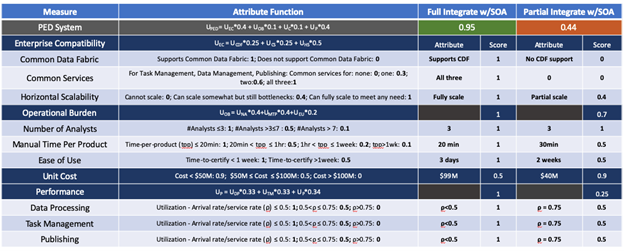
The value functions generated in Figure 12 are based on the mission and stakeholder requirements as well as framed around the context of the problem definition. Based on the weighting, utility functions, and system scores, the clear winner is Option 1 for full integration with the SOA. In terms of sensitivity analysis, the two highest-weighted system attributes were examined; Enterprise Compatibility and Performance. If there were reprieve on the mission requirements for common services and common data fabric, those two attributes would score 1 for both alternatives. If it was assumed that any performance utilization of ρ<1.0 (i.e., as long as the system is not over capacity) gets a score of 1 as well, this would bump alternative 2’s overall value to 0.84, which is still not enough for it to be the favored option. With the costs and budgets as they stand, it is highly unlikely that reprieve would be given on the mission requirements. If cost were to become substantially more constrained, as is the growing case for DoD acquisition programs, the case may be different. If the budget were to get slashed to $50M, a case that is in the realm of possibility, the weighting for system attributes would be changed as shown in Figure 13 below.
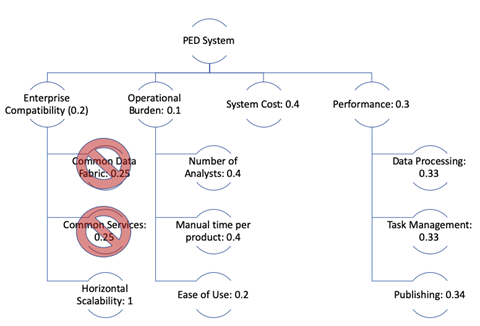
In this scenario, the budget cut to $50M yields reprieve of the requirements for common data fabric and common services, and all leaf-level weighting under enterprise capability goes to horizontal scalability. Additionally, cost is given an increased weighting of 0.4 instead of 0.1, performance is reduced from 0.4 to 0.3, as it is still important to remedy the issues identified in the problem definition, and enterprise capability is reduced from 0.4 to 0.2 as it is no longer quite as valuable in the new cost-constrained environment. As illustrated in Figure 14, this scenario results in option 2, partial integration with the SOA, becoming the better value alternative at 0.81 versus option 1’s 0.60. In this regard, the decision analysis model is primarily sensitive to costs, which should be kept in mind in the event budgets are indeed reduced and the program must re-vector the execution plan. However, for the current budget, option 1 will remain the selected option.
Hard Systems Methodology: Selecting an Option
In accordance with the HSM approach, the evaluation of options has provided an alternative that will meet operational objectives, is technically and organizationally feasible, and is aligned with financial objectives. The resultant design is shown in Figure 15. In the “As Is” system models, inefficiencies were illustrated for the form and function resultant of the linear, stove-piped, non-scalable architectures. The chosen “To Be” design eliminates those inefficiencies through development of common services for Task Management, Data Management, and Publishing callable by any analyst of any mission area while providing a common infrastructure that catalyzes multi-INT discoverability and interoperability.
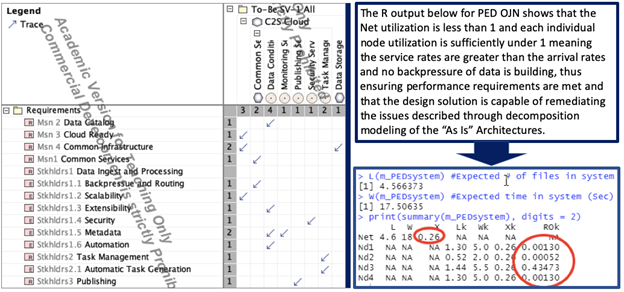
Further, the Requirements Traceability Matrix (RTM) in Figure 16 below illustrates that the allocated baseline for this design will satisfy the requirements with no erroneous allocation. Additionally, the right side of Figure 16 shows that the simulated performance of the Open-Jackson Network (OJN) queuing system for the “To Be” solution results in favorable performance metrics bolstering confidence in the design’s ability to meet requirements and eliminate the problems of the “As Is” system defined in the first part of this paper.
Final Assessments and Conclusion:
This capstone research began with a high-level observation of NASIC’s struggle to keep pace with growing data which was reiterated by the users of the Space and EO PED systems through various interviews. HSM, DoDAF and MBSE provided a demonstrated framework and approach for decomposing that problem into its constituent behavioral and structural parts, thus providing high-granularity insight into commonalities and differences between the disparate stove-piped architectures. The OV-5a helped illustrate the hierarchical functions and commonalities across EO and Space for the processing, exploiting and disseminating functions as well as lower-level functions therein. The OV-5b went further by providing a mechanism to assess commonalities and differences in how lower-level functions interact with one another and the resources that are exchanged. With the OV-5b it become evident that the system performance could be modeled and assessed as an OJN. Only through decomposition and analysis did it become clear what areas of the architecture were indeed driving the problem, which areas could be streamlined, what the key MOP was for the system, and how best to model that performance in manner that is applicable to the current architecture and potential design alternatives. The decomposition modeling led to identification of the two streamlined design alternatives. Multi-attribute Utility Theory and Queuing Theory, catalyzed by the decomposition modeling, led to the selection of the optimal solution to meet identified requirements within budget, ensuring the identified problem could be remedied so that NASIC can optimally meet its mission.
While it has been shown quantitatively, and qualitatively, that the selected option provides the best value solution to problem areas (1) infrastructure/architecture, (2) data, and (3) analysis tools/processes, it does not directly solve problem area (4) workforce culture. The solution to the workforce culture problem will be persistent communication between the program system engineer and the system users. Changing the workforce culture is not a “fire and forget” approach, but rather early and iterative communication strategy using targeted SysML-instantiated DoDAF views and modeling techniques to communicate technical ideas to non-technical stakeholders in order to win hearts and minds, so to speak. This will be accomplished by showing that inefficient processes can be intelligently automated, thus freeing the analysts to focus on the time and content dominant analysis which is so crucial to the Center’s mission. A revitalized workforce who embrace innovation, coupled with flexible technical solutions, will ensure NASIC can continue to grow to meet and exceed mission objectives.
The next step for the selected solution, according to the HSM, is implementation. While implementation is beyond the scope of this capstone, it is worth providing a brief commentary to demonstrate the critical foundation that this research sets as well as additional steps that must be undertaken before implementation should begin. As noted earlier, this problem was bounded to the EO and Space missions of MASINT without explicit consideration towards the other MASINT missions or the other intelligence missions at NASIC such as SIGINT, HUMINT, or GEOINT. That said, this approach is repeatable and applicable to those missions. Ideally, before implementation of full integration with the SOA would begin, the decomposition modeling undertaken for this capstone would be expanded to include those missions in order to identify Center-wide commonalities and optimal areas for streamlining. Once this same approach has been thoroughly applied from a Center-wide perspective, the chosen solution should then be implemented. Additionally, Alex Arlint notes it is crucial to understand that the problem is not then simply solved for good, as the HSM should be embraced through the development and delivery cycle(s) to continually re-evaluate the problem space in the highly-likely event that aspects thereof change, resulting in necessary evolution of the design solution.
Bibliography
Blanchard, B., & Fabrycky, W. (2006). Systems Engineering And Analysis. Upper Saddle River, New Jersey: Pearson Prentice Hall.
Board, B. E. (2014). The Guide to the Systems Engineering Body of Knowledge (SEBoK), version 1.3. (R. A. (EIC), Ed.) Hoboken, NJ.
Bottomley, S. (2021, January 19 ). EO Team Lead. (A. Arlint, Interviewer)
Buede, D., & Milller, W. (2016). The Engineering Design of Systems. (A. P. Sage, Ed.) Hoboken, New Jersey: John Wiley and Sons, Inc.
Burge, S. (2015). An overview of the Hard Systems Methodology. Retrieved from System Thinking: Approaches and Methodologies: https://www.burgehugheswalsh.co.uk/Uploaded/1/Documents/Hard-Systems-Methodology1.pdf
Crawley, E. (2016). System Architecture. Essex, England: Pearson.
DoD. (2009, May 28). DoD Architecture Framework Version 2.0. Volume 2: Architecture Data and Models – Architect’s Guide. DoD.
Godar, T. (2020, December). Darkstar Engineer. (A. Arlint, Interviewer)
Kimmons, J., & Gilmer, G. (2019). Remaking Intelligence Processing, Eploitation and Dissemination. Booze Allen Hamilton.
Maier, M. W., & Rechtin, E. (2009). The Art of Systems Architecting. Boca Raton, Florida: Taylor & Francis Group, LLC.
Modigliani, P. (2016). How Defense Acquisition Can Enable Innovation . Acquisition Research Symposium (p. 144). The MITRE Corporation.
Montoya, Y., & Jimenez, C. (2017, December 2). Queuing: A Package For Analysis Of Queuing Networks and Models in R. The R Journal, 9.
NSA. (2000). Decision Analysis Handbook. Central Security Service.
Stackexchange. (2015, January 23). Test if 2 exponentially distributed datasets are different. Retrieved from stackexchange: https://stats.stackexchange.com/questions/134656/test-if-2-exponentially-distributed-datasets-are-different